Infographics
Infographics are effective in educational contexts because they use images to highlight, clarify, or enrich text-based information. They capture your learner’s attention while helping them understand and retain the information. As long as you stay within the copyright laws, you are able to use infographics from other sources.
For AODA complianceaccessibility, consider adding a text description below the infographic for screen reader users or those that prefer a text alternative. Also ensure that there is enough colour contrast between the text and the background for the text to be easily readoptimal perceptibility.
Lets take a look at some of the advantages of using an infographic by reviewing …an infographic! As you review this infographic, consider how quickly you are able to attain the information.
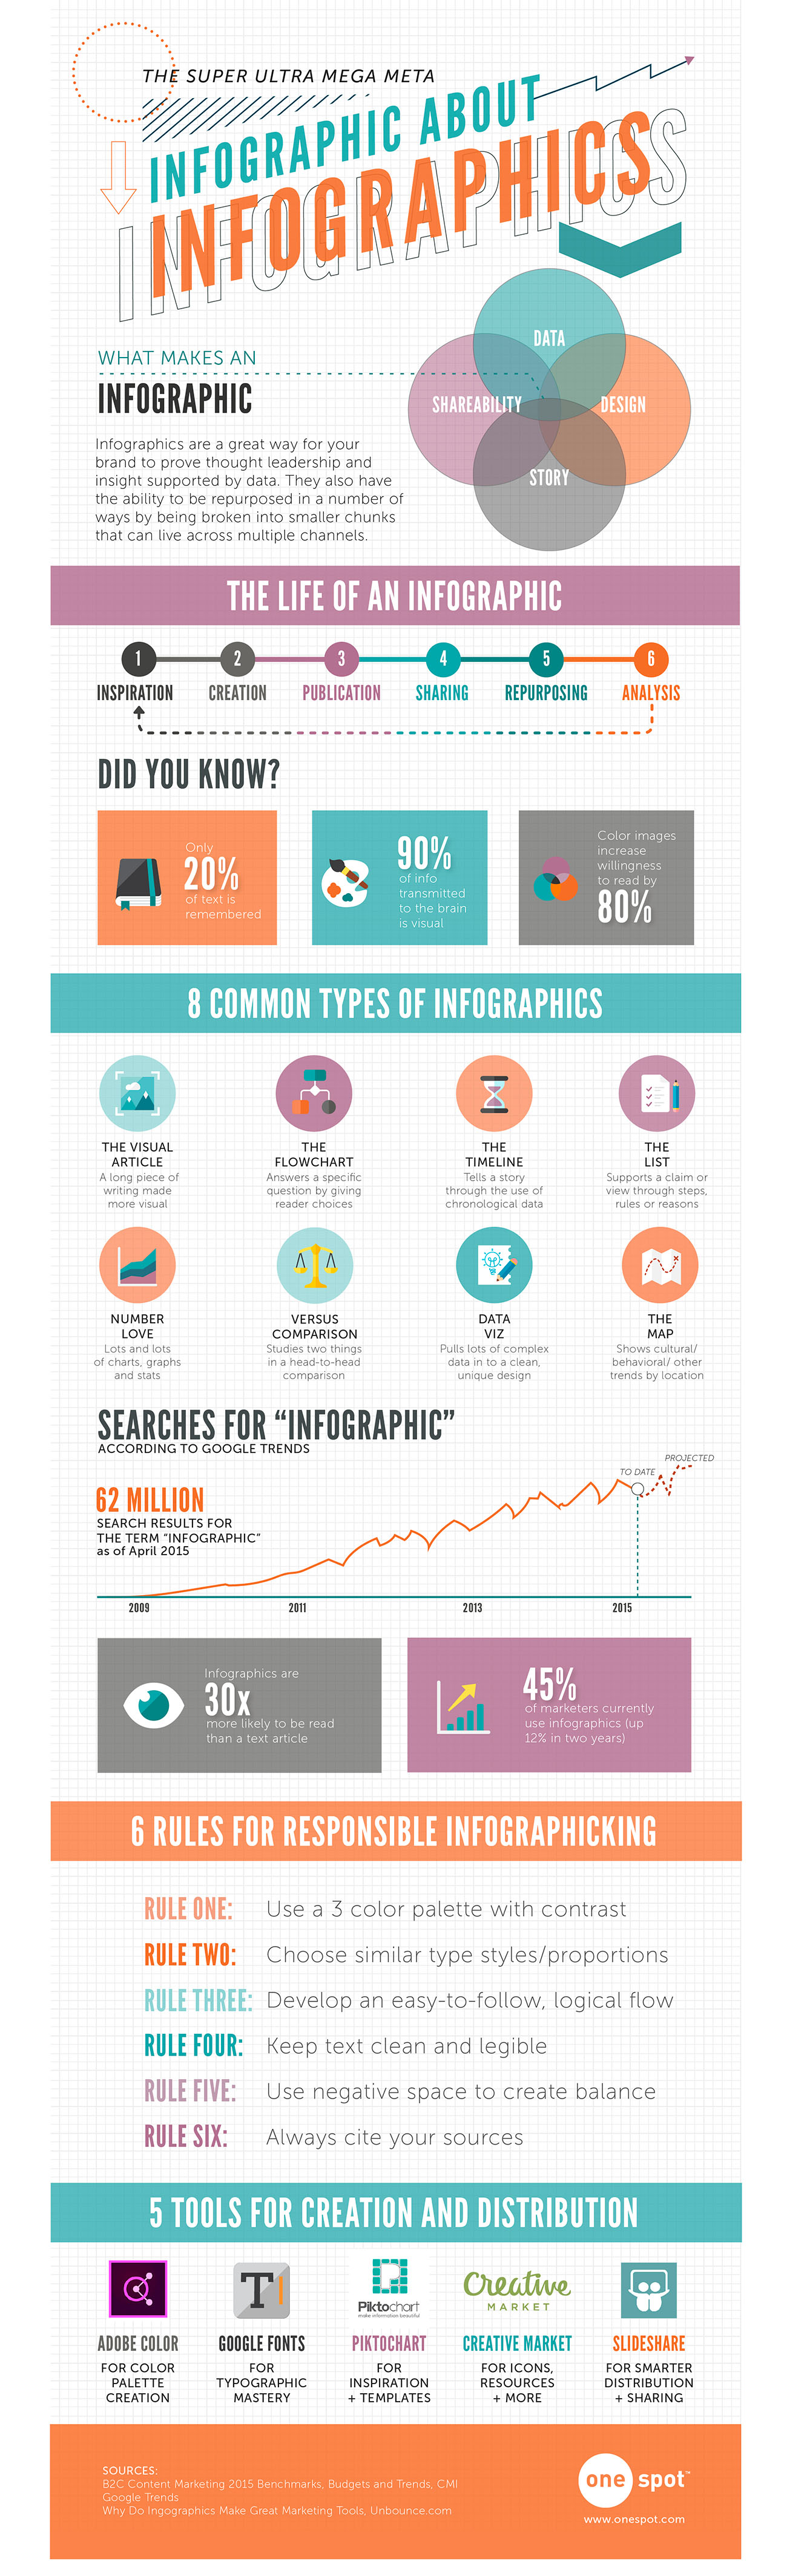
The Super Ultra Mega Meta Infographic about Infographics
What Makes an Infographic
Venn diagram with 4 circles:
- Data
- Design
- Story
- Shareability
Infographics are a great way for your brand to prove thought leadership and insight supported by data. They also have the ability to be repurposed in a number of ways by being broken into smaller chunks that can live across multiple channels.
The Life of an Infographic
- Inspiration
- Creation
- Publication
- Sharing
- Repurposing
- Analysis (and the cycle repeats)
Did You Know?
- Only 20% of text is remembered
- 90% of info transmitted to the brain is visual
- Color images increase willingness to read by 80%
8 Common Types of Infographics
- The Visual Article: A long piece of writing made more visual
- The Flowchart: Answers a specific question by giving reader choices
- The Timeline: Tells a story through the use of chronological data
- The List: Supports a claim or view through steps, rules or reasons
- Number Love: Lots and lots of charts, graphs, and stats
- Versus Comparison: Studies two things in a head-to-head comparison
- Data Viz: Pulls lots of complex data in to a clean, unique design
- The Map: Shows cultural/behavioral/ other trends by location
Searches for "infographic" according to Google Trends: 62 million search results for the term "infographic" as of April 2015.
Infographics are 30 times more likely to be read than a text article.
45% of marketers currently use infographics (up to 12% in two years).
6 Rules for Responsible Infographicking
- Rule One: Use a 3 color palette with contrast
- Rule Two: Choose similar type styles/proportions
- Rule Three: Develop an easy-to-follow, logical flow
- Rule Four: Keep text clean and legible
- Rule Five: Use negative space to create balance
- Rule Six: Always cite your sources
5 Tools for Creation and Distribution
- Adobe Color: for color palette creation
- Google Fonts: for typography mastery
- Piktochart: for inspiration and templates
- Creative Market: for icons, resources, and more
- Slideshare: for smarter distribution and sharing
Sources:
B2C Content Marketing 2015 Benchmarks, Budgets and Trends, CMI Google Trends
Why do Infographics Make Great Marketing Tools, Unbounce.com
Infographic by: OneSpot
As well, you may want to consider using some of the following resources to create your own infographic:
| Resource Name | Main Functionality | Considerations | Help/How-To Guides: |
|---|---|---|---|
| Canva | Easy-to-use graphic design, infographic creator. No design experience required. Upload own images and graphics. Invite collaborators to contribute to design. Download designs as PDF, JPG or PNG. Share designs with link. | 8,000+ free templates; 100+ design types (social media posts, presentations, letters, and more); Hundreds of thousands of free photos and graphics. Premium templates, photos and graphics available. | Getting started with Canva |
| Genially | Create interactive content that incorporates animations, gamification, integrations of weblinks and other online tools. | The free version provides unlimited creations and visits. Content created with the free plan lives in the Genially website; it is public and accessible through a link. Content can't be downloaded. | Getting Started with Genially |
| Piktochart | Infographic and graphic design tool. No design experience necessary. Drag and drop editor with many free templates, icons, images and design types to choose from. | You can create up to 5 designs simultaneously with the free plan. After you finish a design, you can download it and delete it from your dashboard. This will free up one spot for a new design. | Piktochart Support |