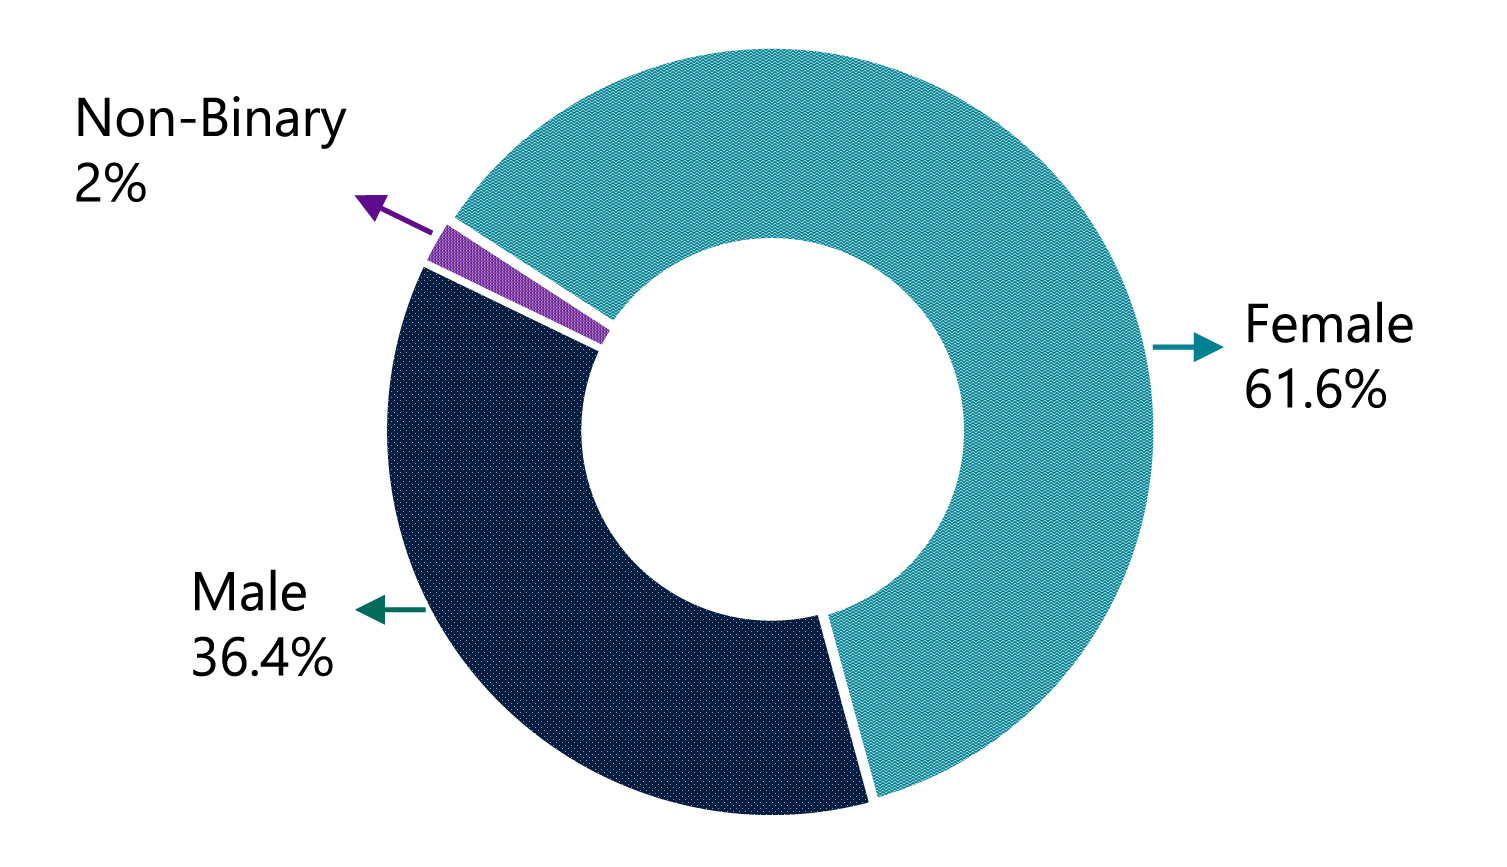
Gender Identity
Approximately 60% of students identify as female, 36% as male, and 2% as gender non-binary, trans or transgender, or other.
Humber College
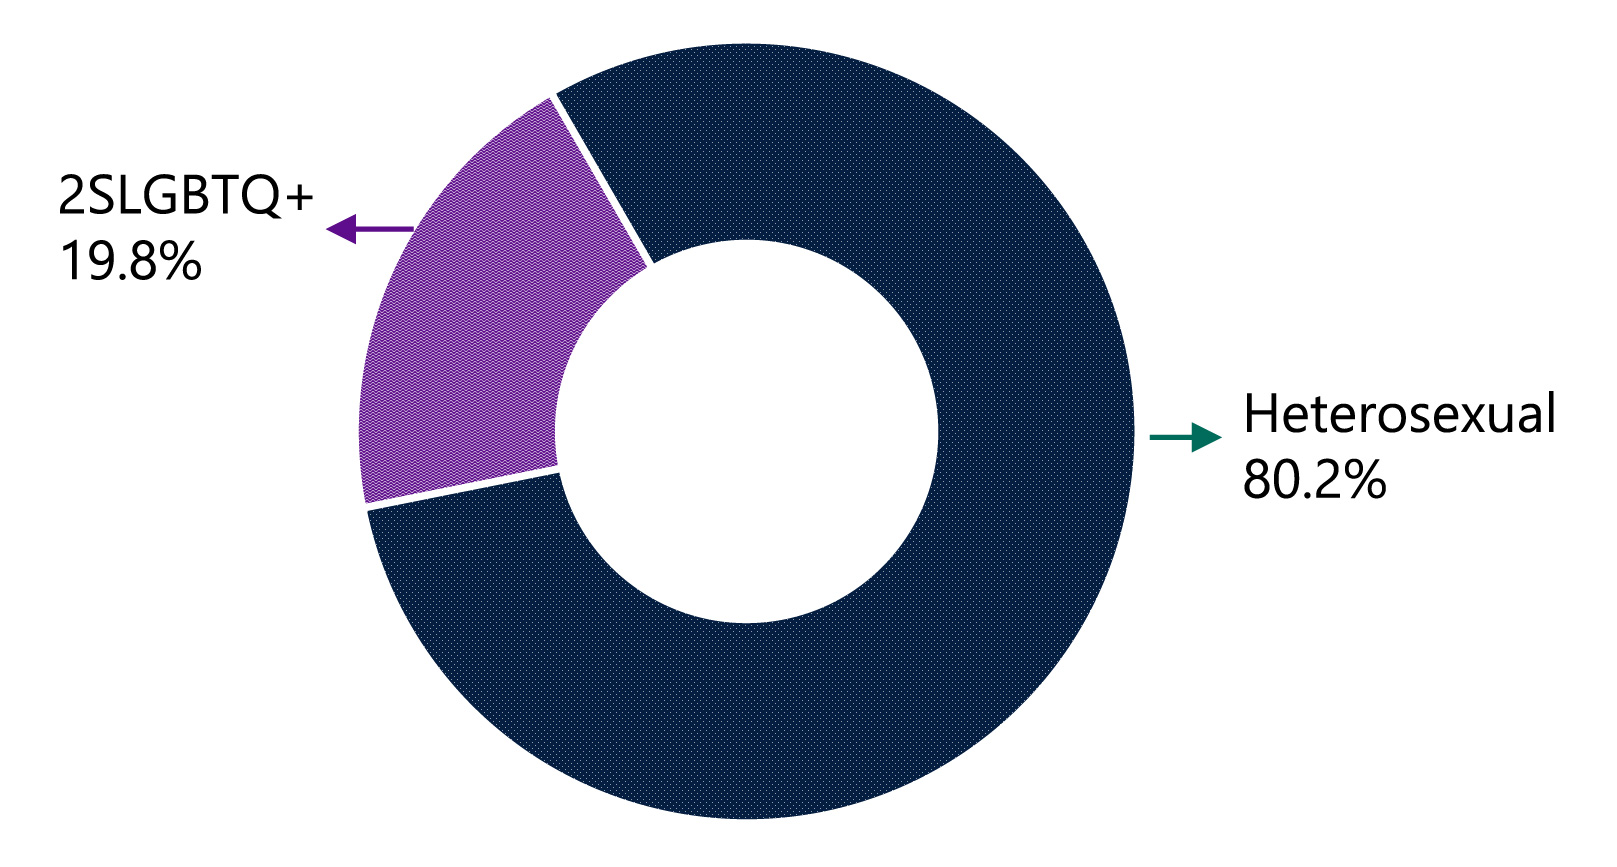
Sexual Orientation
Approximately 80% of students identify as heterosexual and 20% identify as members of the 2SLGBTQ+ community (bisexual, gay, pansexual, queer, lesbian, questioning, asexual, two-spirit, or other).
Humber College
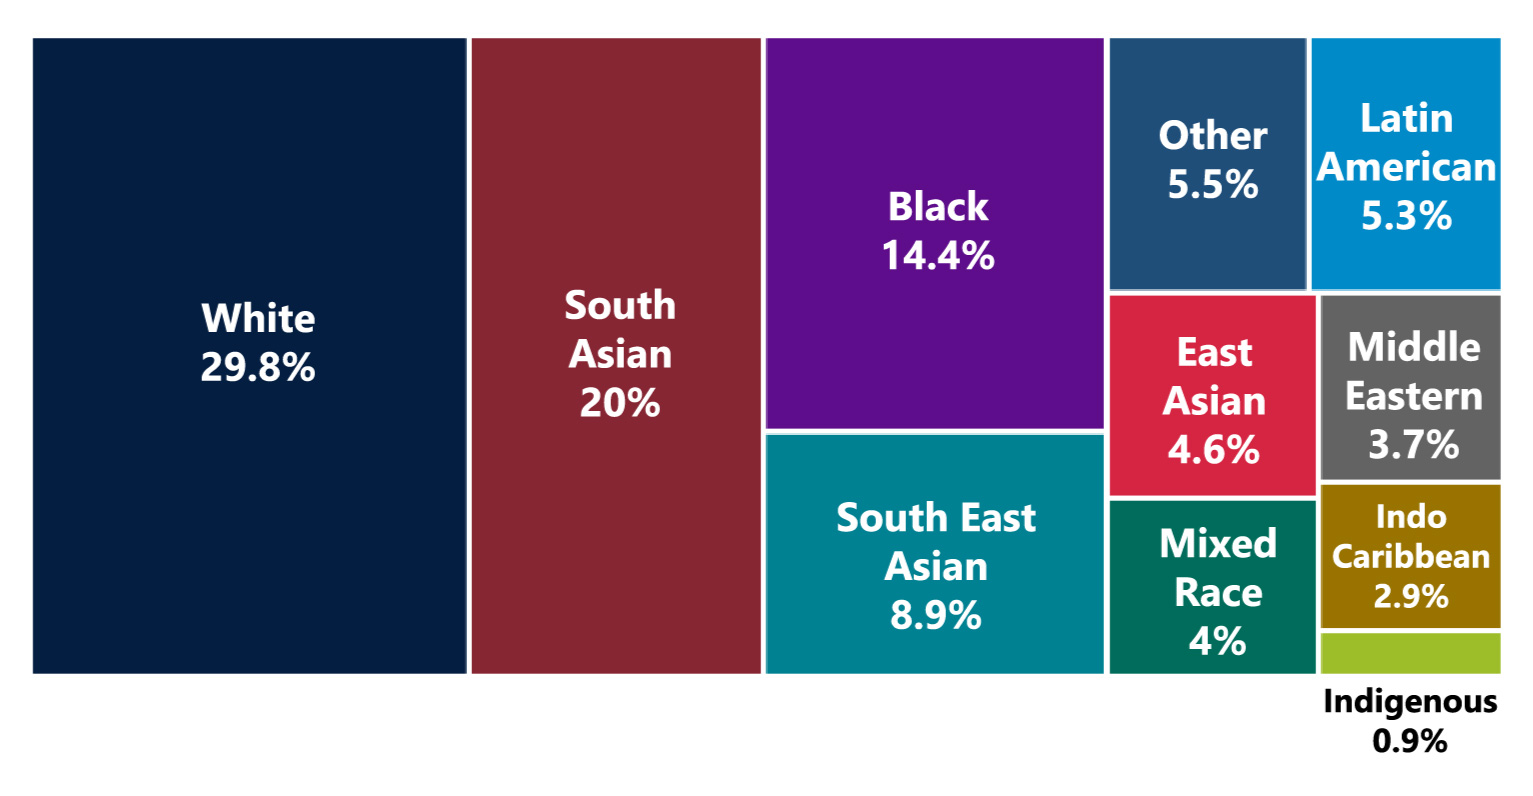
Racial Background
Humber's student population is heavily racialized, representing 70% of self-identified respondents.
Humber College
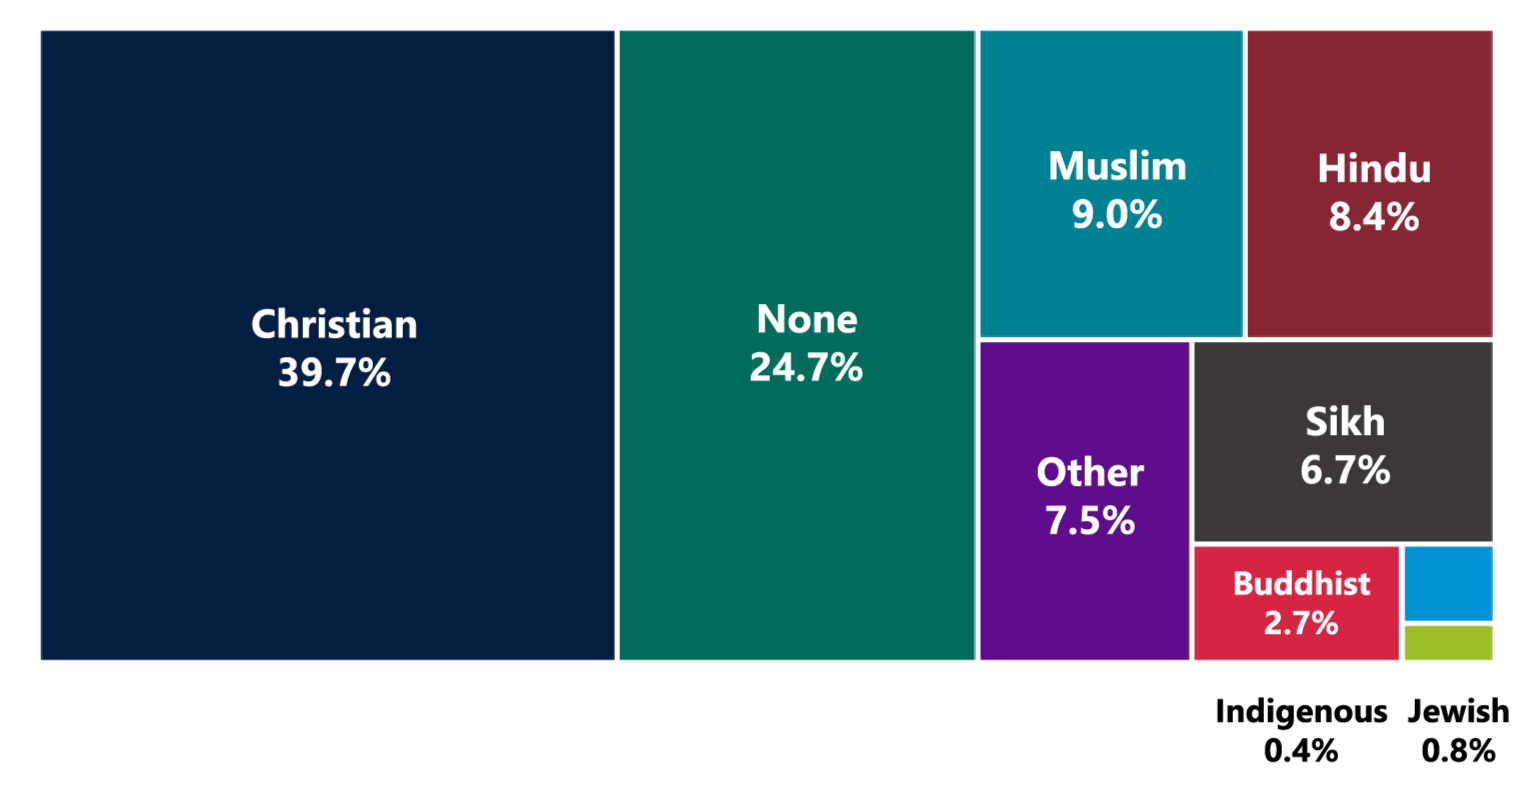
Religion
Humber's student population is representative of a wide range of religious beliefs and values with 40% holding religious beliefs other than Christian or non-religious.
Humber College
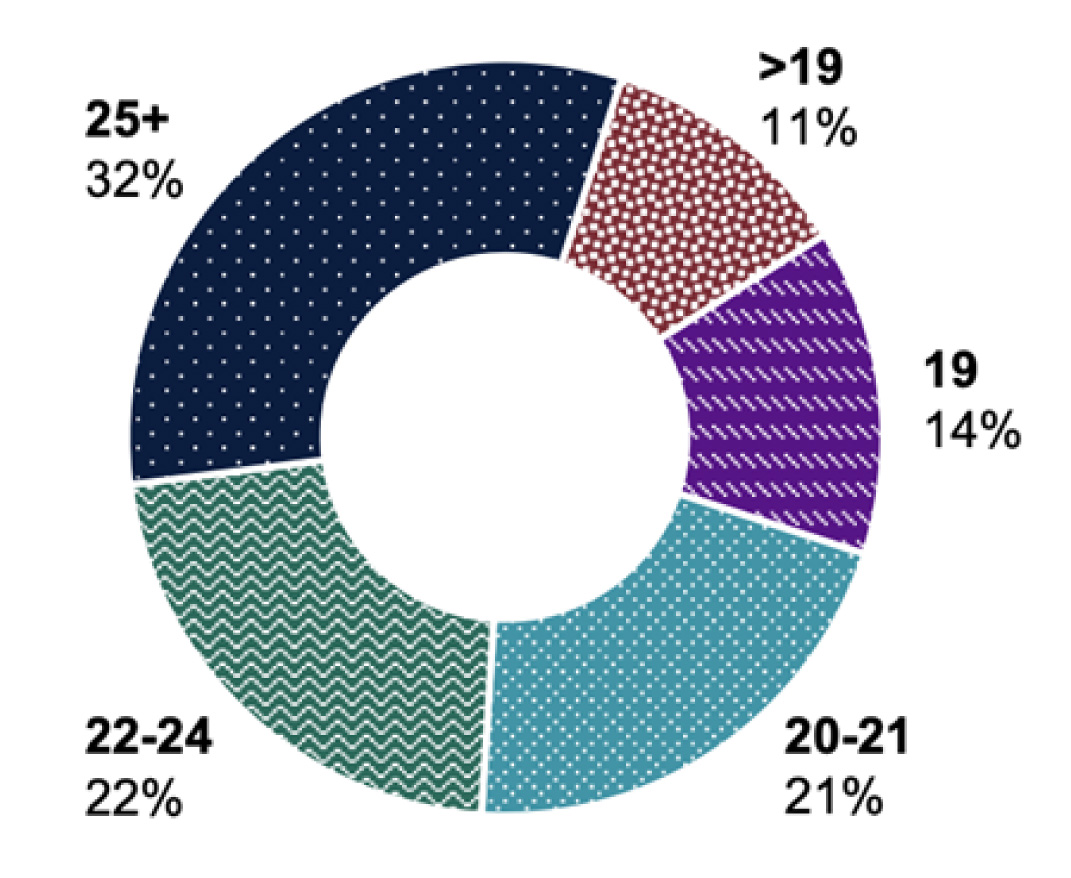
Age
Students 25 years or older represent 32% of Humber's student population. Students under the age of 25 comprise the remaining 68%.
Humber College
Disabilities
Among the students with disabilities who responded to the Fall 2020 survey, 74% reported that their condition(s) had a negative impact on their academic performance.
Finances
- 76% of students were concerned with paying tuition
- 56% of students were concerned about financing their housing needs
- 53% of students were concerned about paying for food
- Approximately 1 in 4 students were “very concerned” about each category
Demands on Time
- 1/3 of students work >16 hours/week
- 12% spend >16 hours/week caring for dependents